Visualizing Aquaculture Water Quality
Maintaining healthy culture water means managing water chemistry.
But water chemistry is a tech topic filled with equations and confusing concepts.
That's a pain point for many aquaculturists, especially in recirc systems (RAS).
A visual approach makes managing water quality (WQ) so simple that anyone who can use Google Maps can manage their culture environment with the Water Quality Map.
Below, an interactive intro to visual WQ control with the Water Quality Map.
1 of 7
From equations to a Water Quality Map
The carbonate system is the backbone of aquaculture water chemistry.
For ease of use, the carbonate system equations can be transformed into a Water Quality Map.
The x-axis is Dissolved Inorganic Carbon (DIC): the sum of [CO2], [bicarbonate ion], & [carbonate ion].
Alkalinity buffers pH changes and is on the y-axis.
A family of pH lines is projected onto the map.
View the video, then scroll to see how this approach simplifies WQ management and education.
2 of 7
A topographic map of pH
Aquaculture water quality can be visualized with a modified Deffeyes Diagram (Alkalinity vs DIC).
Lines of equal pH are like lines of equal elevation on a topographic map.
Where they're closer together, pH changes rapidly. Those are regions of weak buffering.
pH topography depends on temperature & salinity.
Change temperature & salinity to change the pH topography.
3 of 7
Plot your current water quality
pH & [Alk] define your location on the map .
That determines un-ionized ammonia-nitrogen (UIA-N), dissolved CO2, carbonate saturation (Ω), and other key WQ properties.
Change pH & alkalinity to plot your water quality.
4 of 7
Plot the UIA-N Danger Zone
The toxic ammonia boundary is the pH above which UIA-N exceeds a species' tolerance.
Both higher Total Ammonia-Nitrogen (TA-N) and lower UIA-N tolerance expand the toxic region.
Change TA-N & UIA-N tolerance to modify the danger zone.
5 of 7
Plot the CO2 Danger Zone
The boundary of the CO2 danger zone is the highest CO2 that a species tolerates.
It's often ~10 - 15 mg/L, but it's lower for larvae and up to 60 mg/L for a hardy species like Tilapia.
Change CO2 tolerance to change the danger zone.
6 of 7
The Aragonite Saturation Zone (Ωar)
Aragonite (Ωar) & calcite (Ωca) saturation are important for shell & bone formation. Both are super-saturated in seawater (Ωar ≈ 3) and vary with pH, [Alk], temperature, salinity, and calcium level.
In seawater, [Ca⁺⁺] is steady between ~420 - 424 mg/L. In freshwater, it's usually ~15 mg/L, but it varies widely from ~5 to > 500 mg/L.
Change [Ca⁺⁺] to see calcium's effect on aragonite saturation. Change Ωar to set a target aragonite saturation zone.
7 of 7
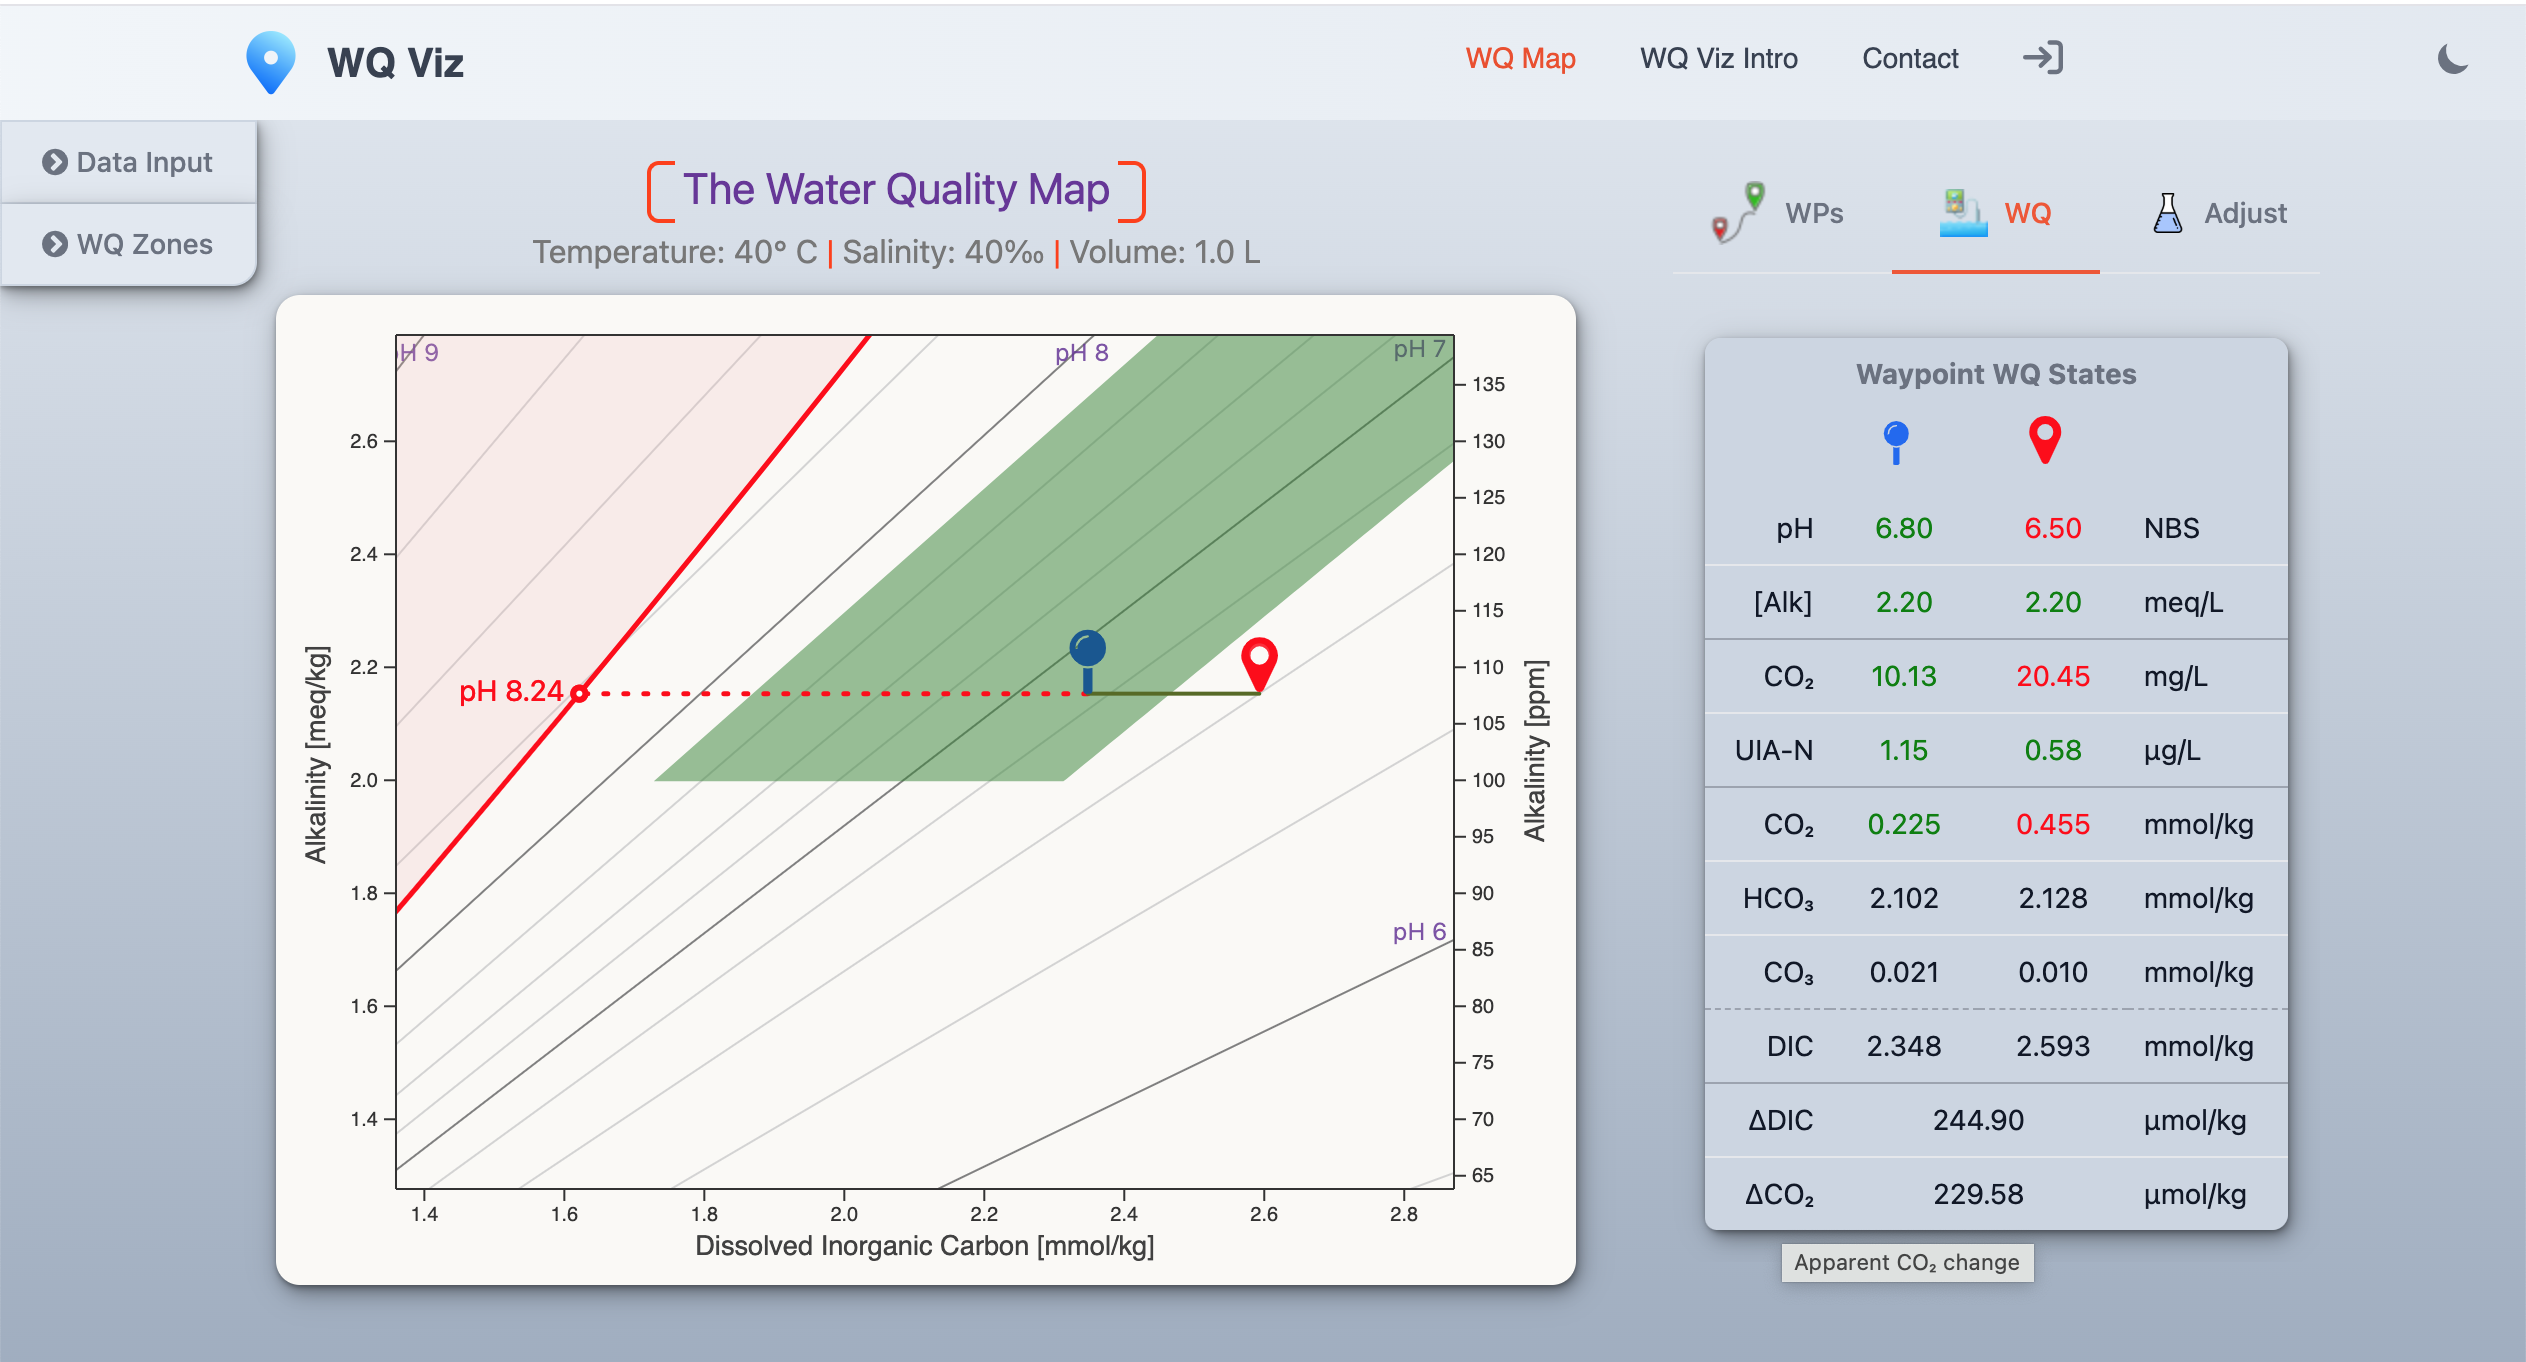
The Green Zone
It's practical to display your species' Green Zone, the region where its WQ requirements are met.
Here, the boundaries are the UIA-N & CO2 danger zones, plus adjustable min and max alkalinities.
In other cases, aragonite (or calcite) saturation may be used as a Green Zone boundary.
What can you do with the WQ Map?
You can plot a course that keeps your species in its Green Zone for good growth and survival.
The pin is outside the Green Zone. Select one or two reagents to see the safe areas they reach.
 max pH at 422 ppm atmospheric CO2
That's useful qualitative information. The map also calculates the amounts of reagents to add for precise water-quality control. (see screenshot below)
Navigate through your WQ environment
The screenshot shows an example WQ adjustment calculated by the Water Quality Map to reach the target waypoint and maintain the major ionic ratios.
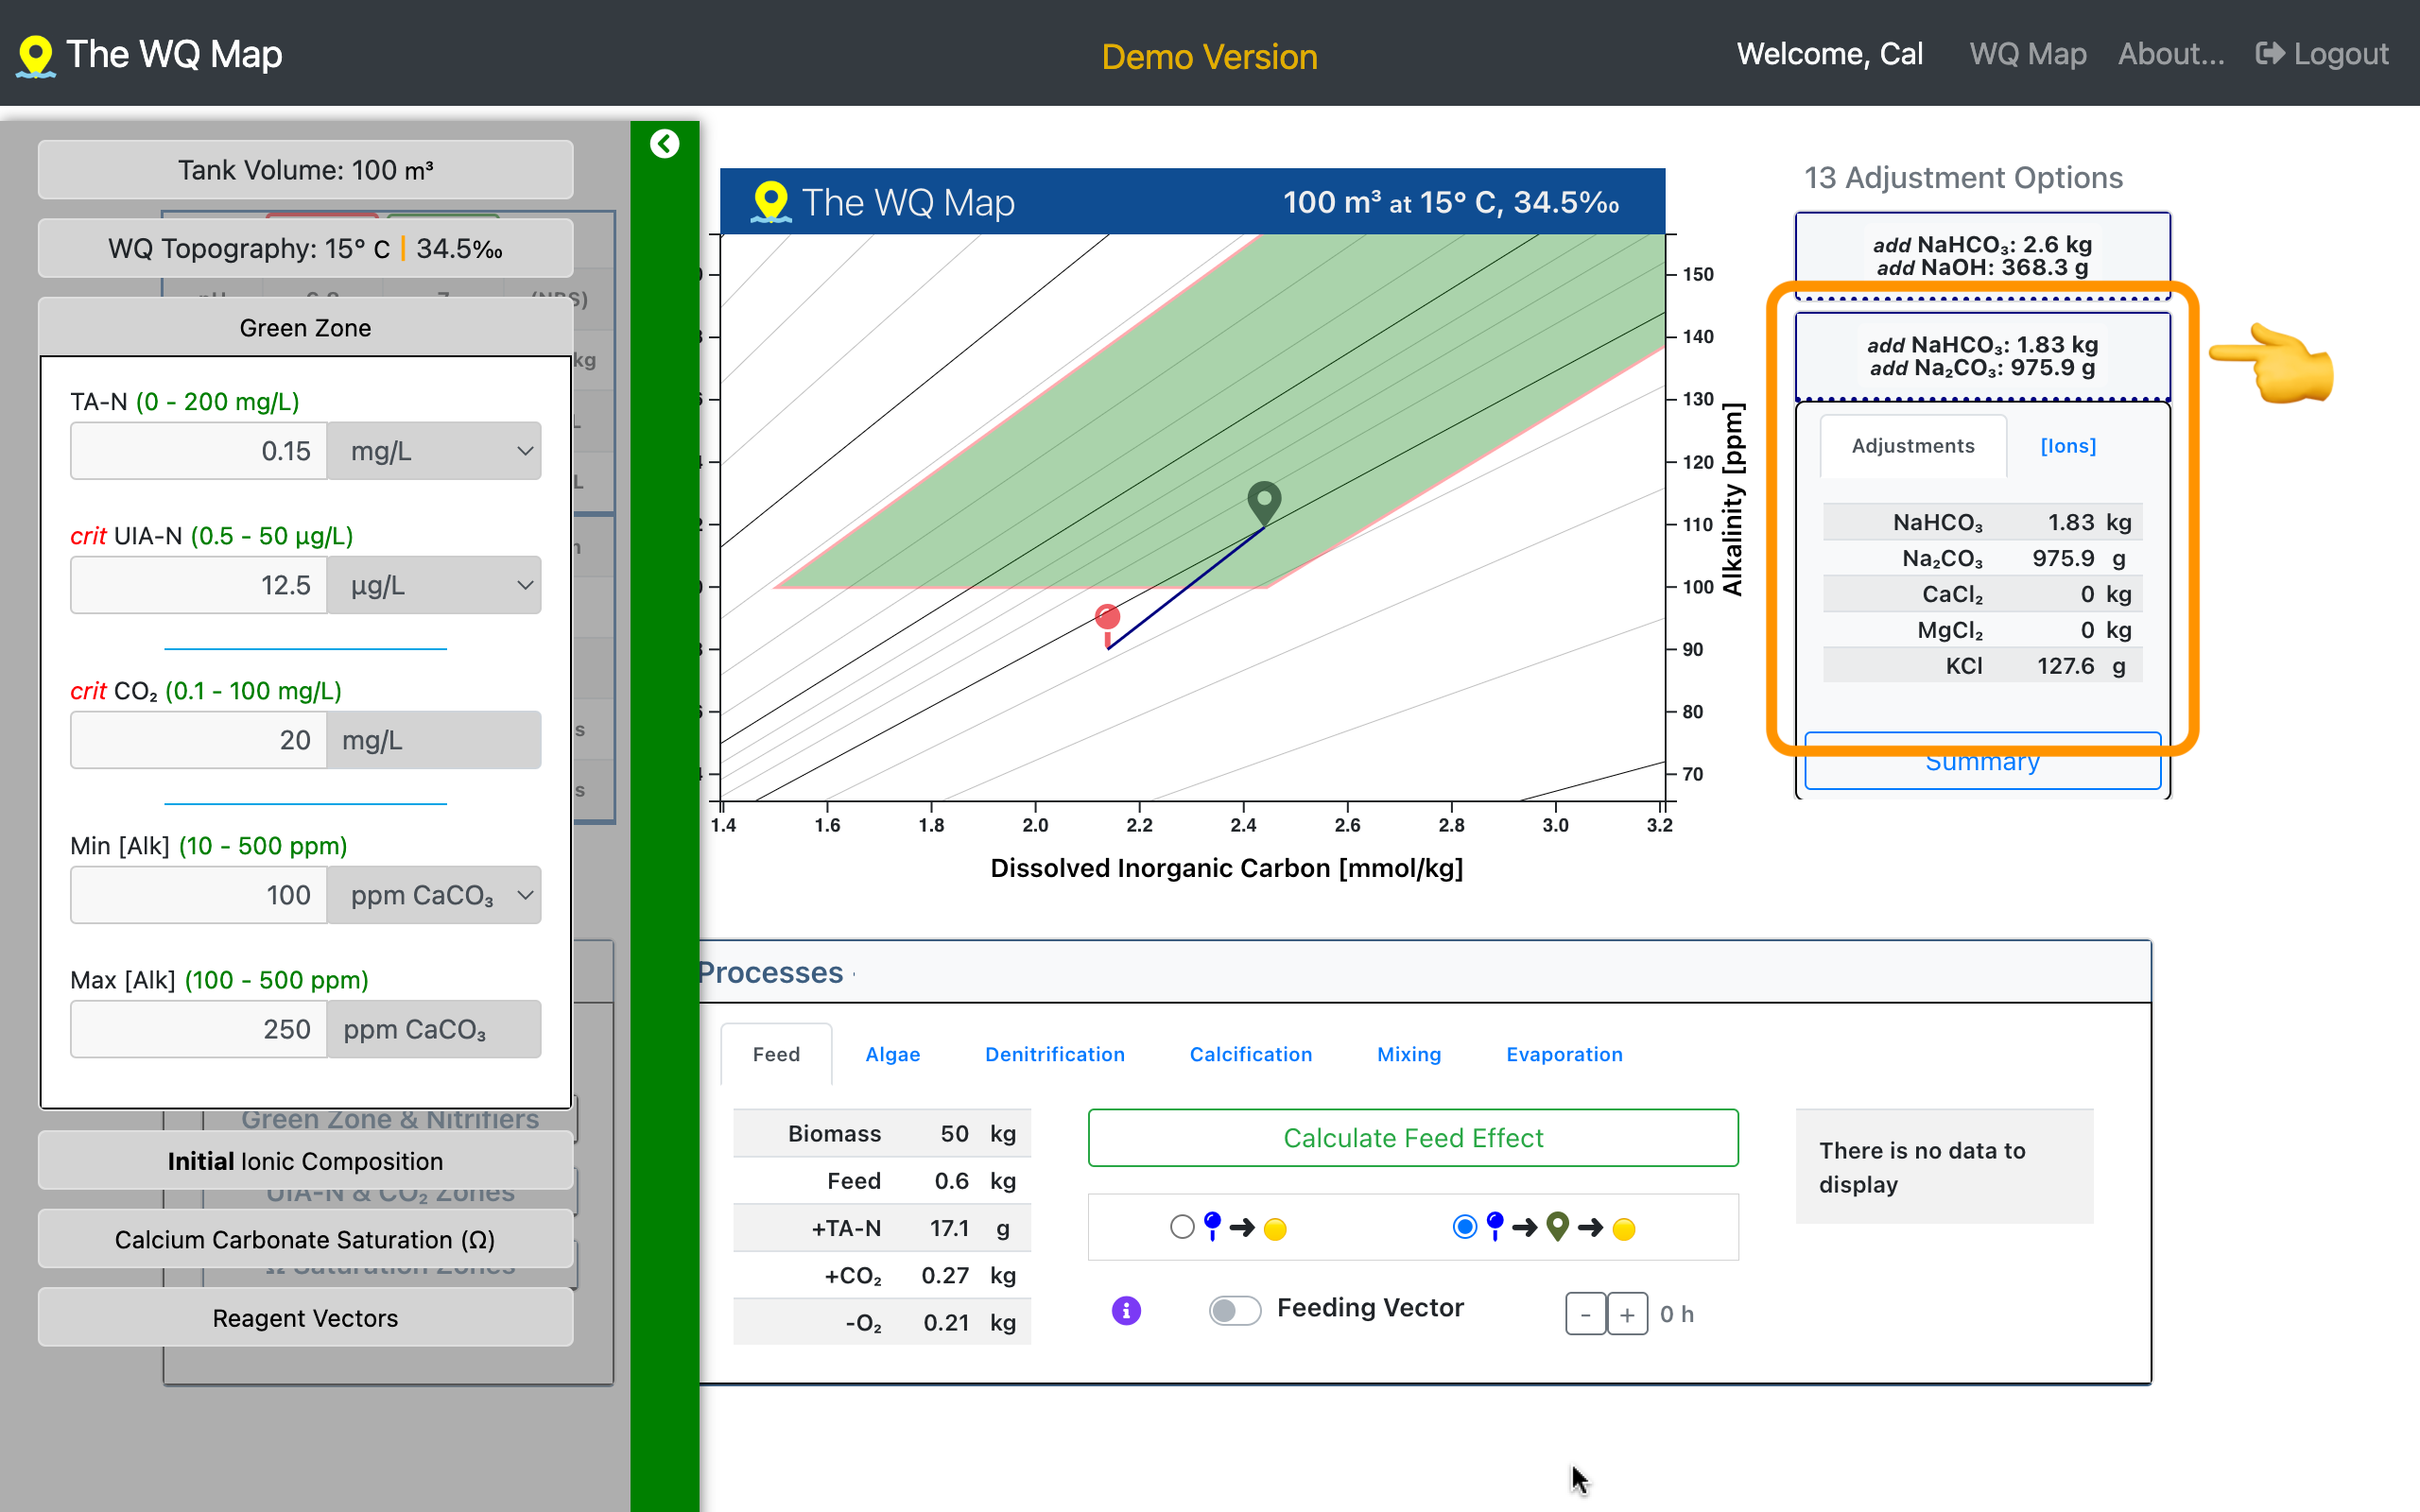
In this case, among 13 options, the sodium bicarbonate + sodium carbonate combination is highlighted. Potassium chloride (KCl) adjusts the Na:K ratio.
Closing the 'RAS skills gap'
The Water Quality Map is also an effective training tool.
Anyone wandering within the water-quality wilderness without a map can use it to manage culture water without diving into the deep end of chemistry and math.
You'll find further info and examples in the WQ | FAQ Blog.